Reliability Analysis of Smart Grids using Theorem Proving
Mohamed Wagdy Eldesouki Abdelghany and Sofiene Tahar
Contact: m_eldes@encs.concordia.ca
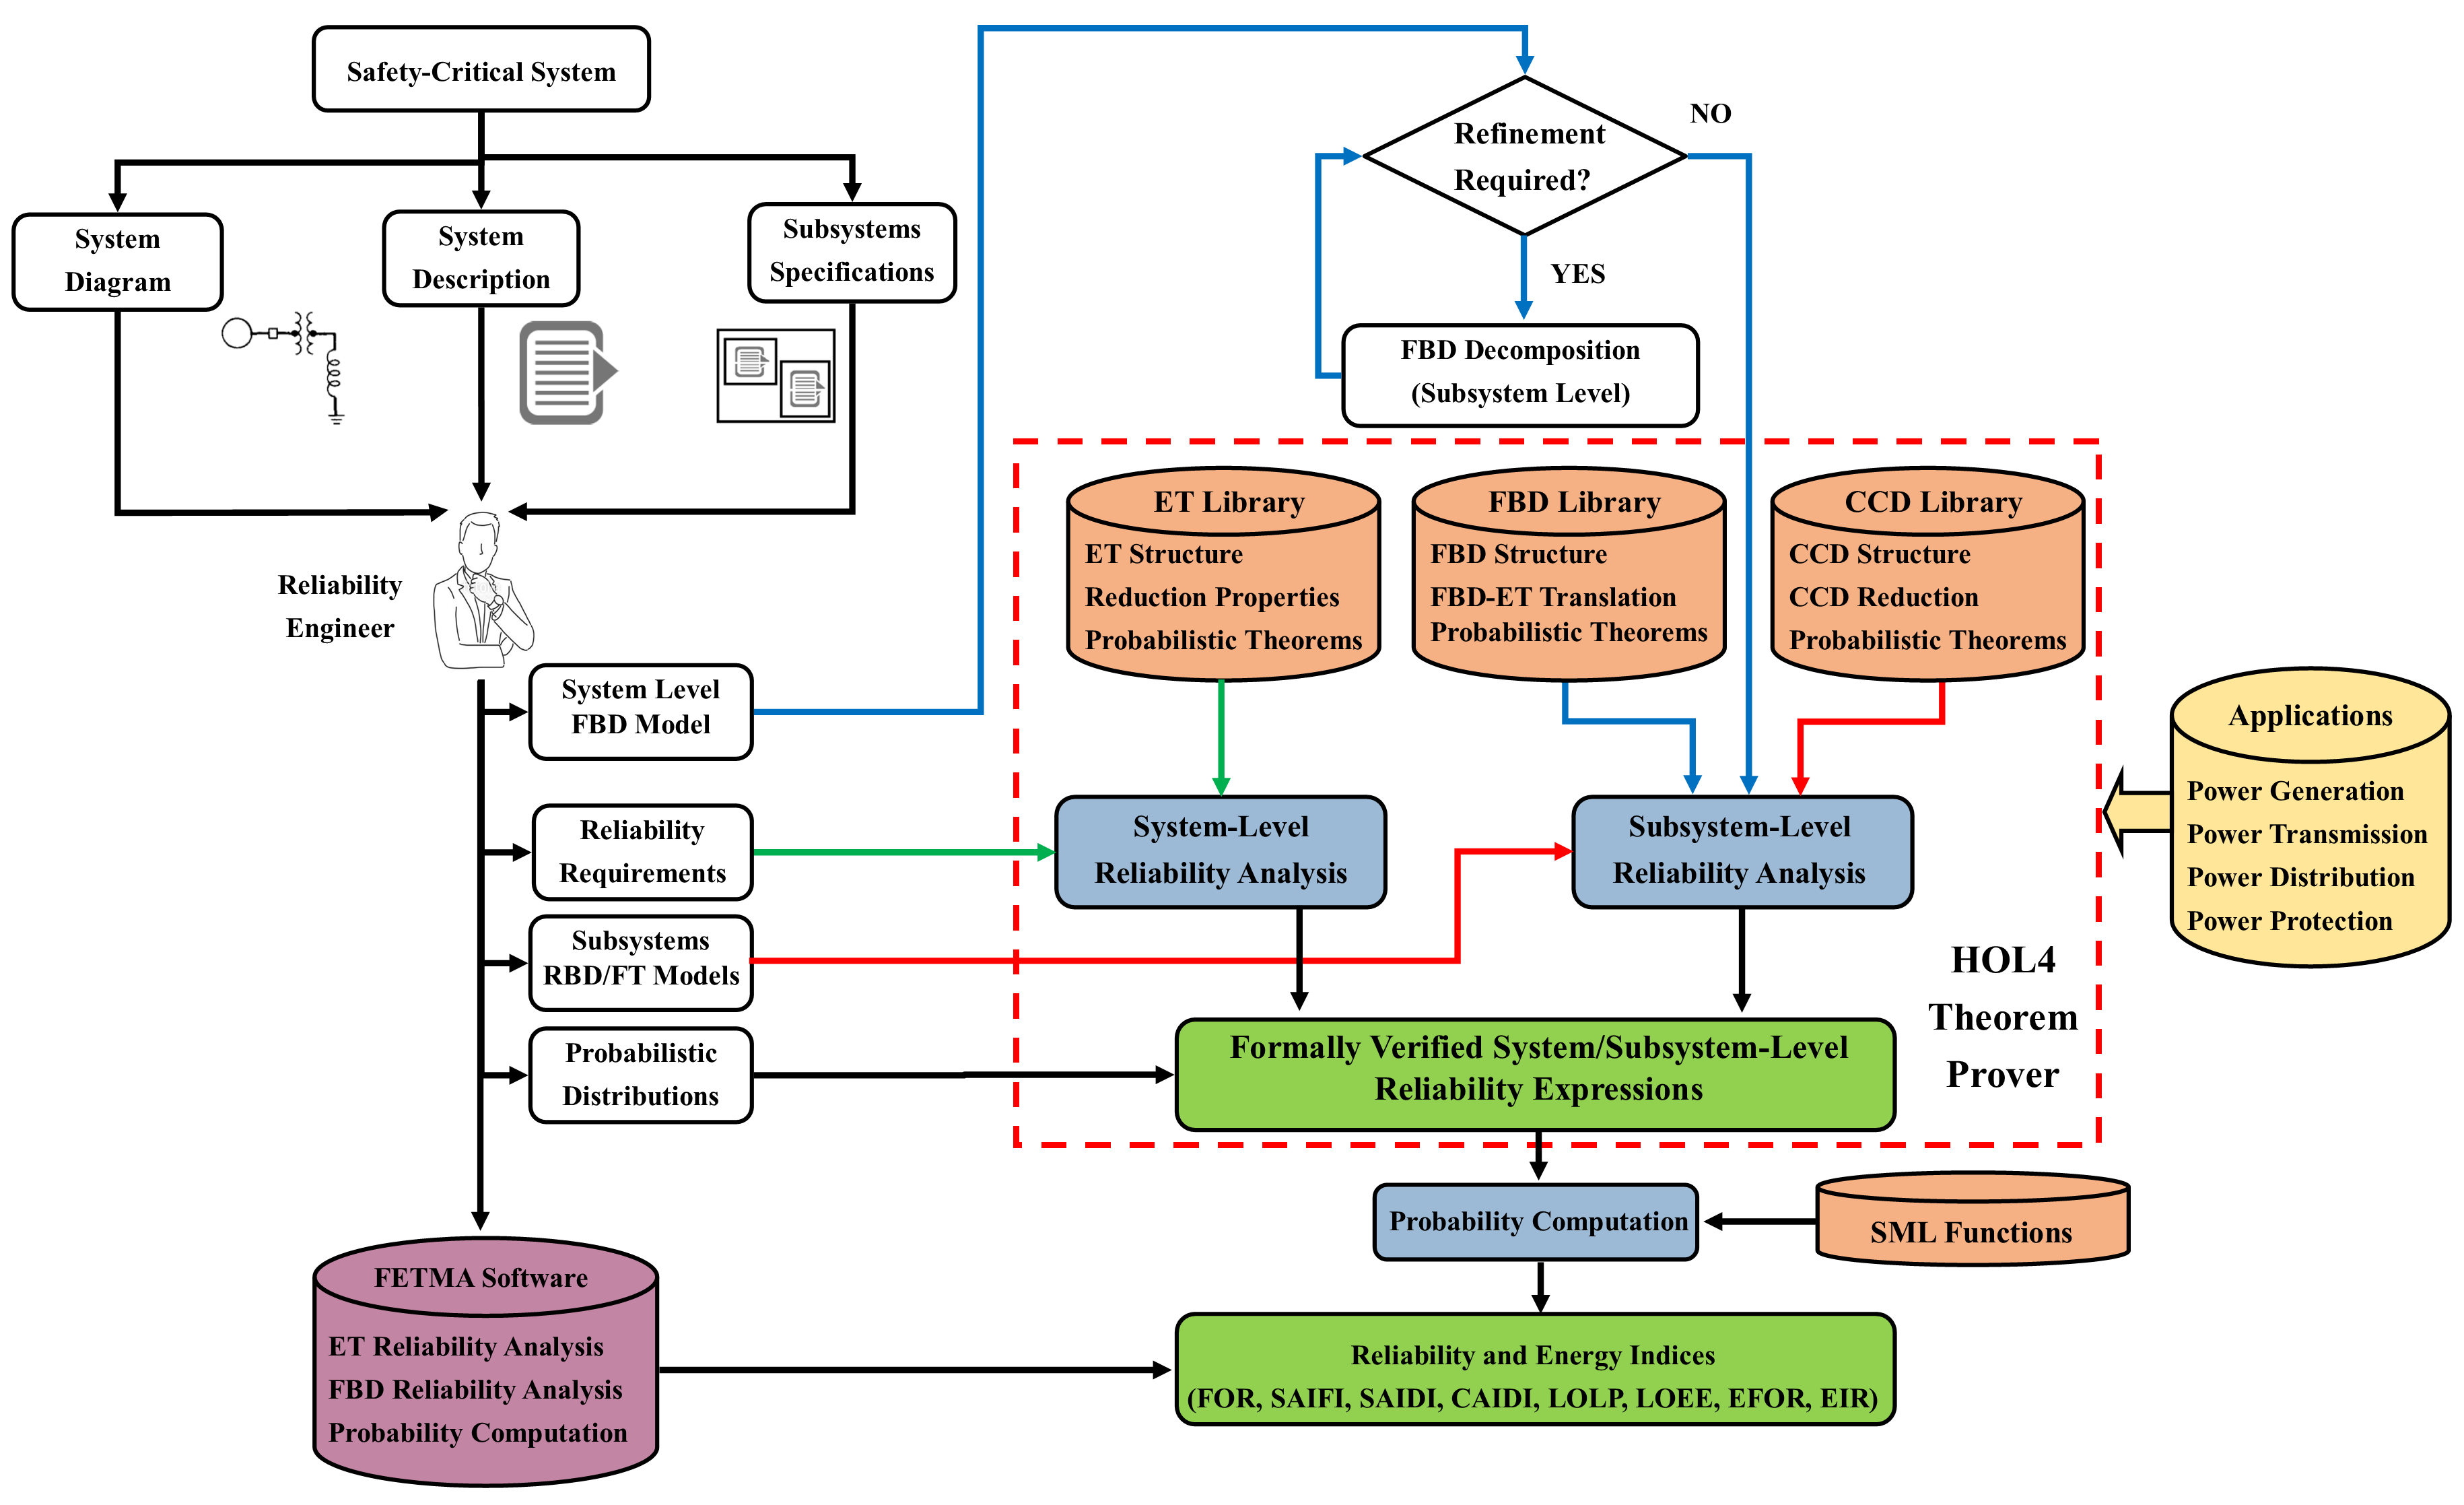
Smart Grids (SG) are complex integrated electric networks, where failures in any zone of the network can cause widespread catastrophic disruption of supply. In recent years, there has been a significant proliferation in the use of Renewable Energy Sources, such as wind/solar systems, for SG power generation due to global warming, pollution as well as economic and energy security concerns. However, the main obstacle that this energy systems face is their intermittent nature, which greatly affects their ability to deliver constant power to the grid. While this raises several reliability-related concerns, existing sampling-based simulation tools, such as the Monte-Carlo approach, cannot guarantee absolute accuracy of the reliability analysis results due to their inherent incompleteness. Therefore, in this framework, we propose a novel approach that uses formal methods for the accurate and sound reliability analysis of SG systems. This new methodology overcomes the incompleteness of simulation-based analysis and the error-proneness of manual mathematical analysis. In particular, we use higher-order logic (HOL) theorem proving, which is a computer-based mathematical reasoning tool, where we developed a library of fundamental concepts of reliability analysis techniques, such as Event Trees (ET), Functional Block Diagrams (FBD), and Cause-Consequence Diagrams (CCD). This library allowed us to conduct formal system/subsystem-level reliability analysis and determine absolute accuracy of important SG reliability and energy indices, such as Forced Outage Rate (FOR), System/Customer Average Interruption Frequency and Duration (SAIFI, SAIDI and CAIDI), Loss of Load Expectation (LOLP), Loss of Energy Expectation (LOEE), Equivalent Forced Outage Rate (EFOR), and Energy Index of Reliability (EIR), using the HOL4 theorem prover.
1- IEEE 3-Bus Composite Bulk Power System
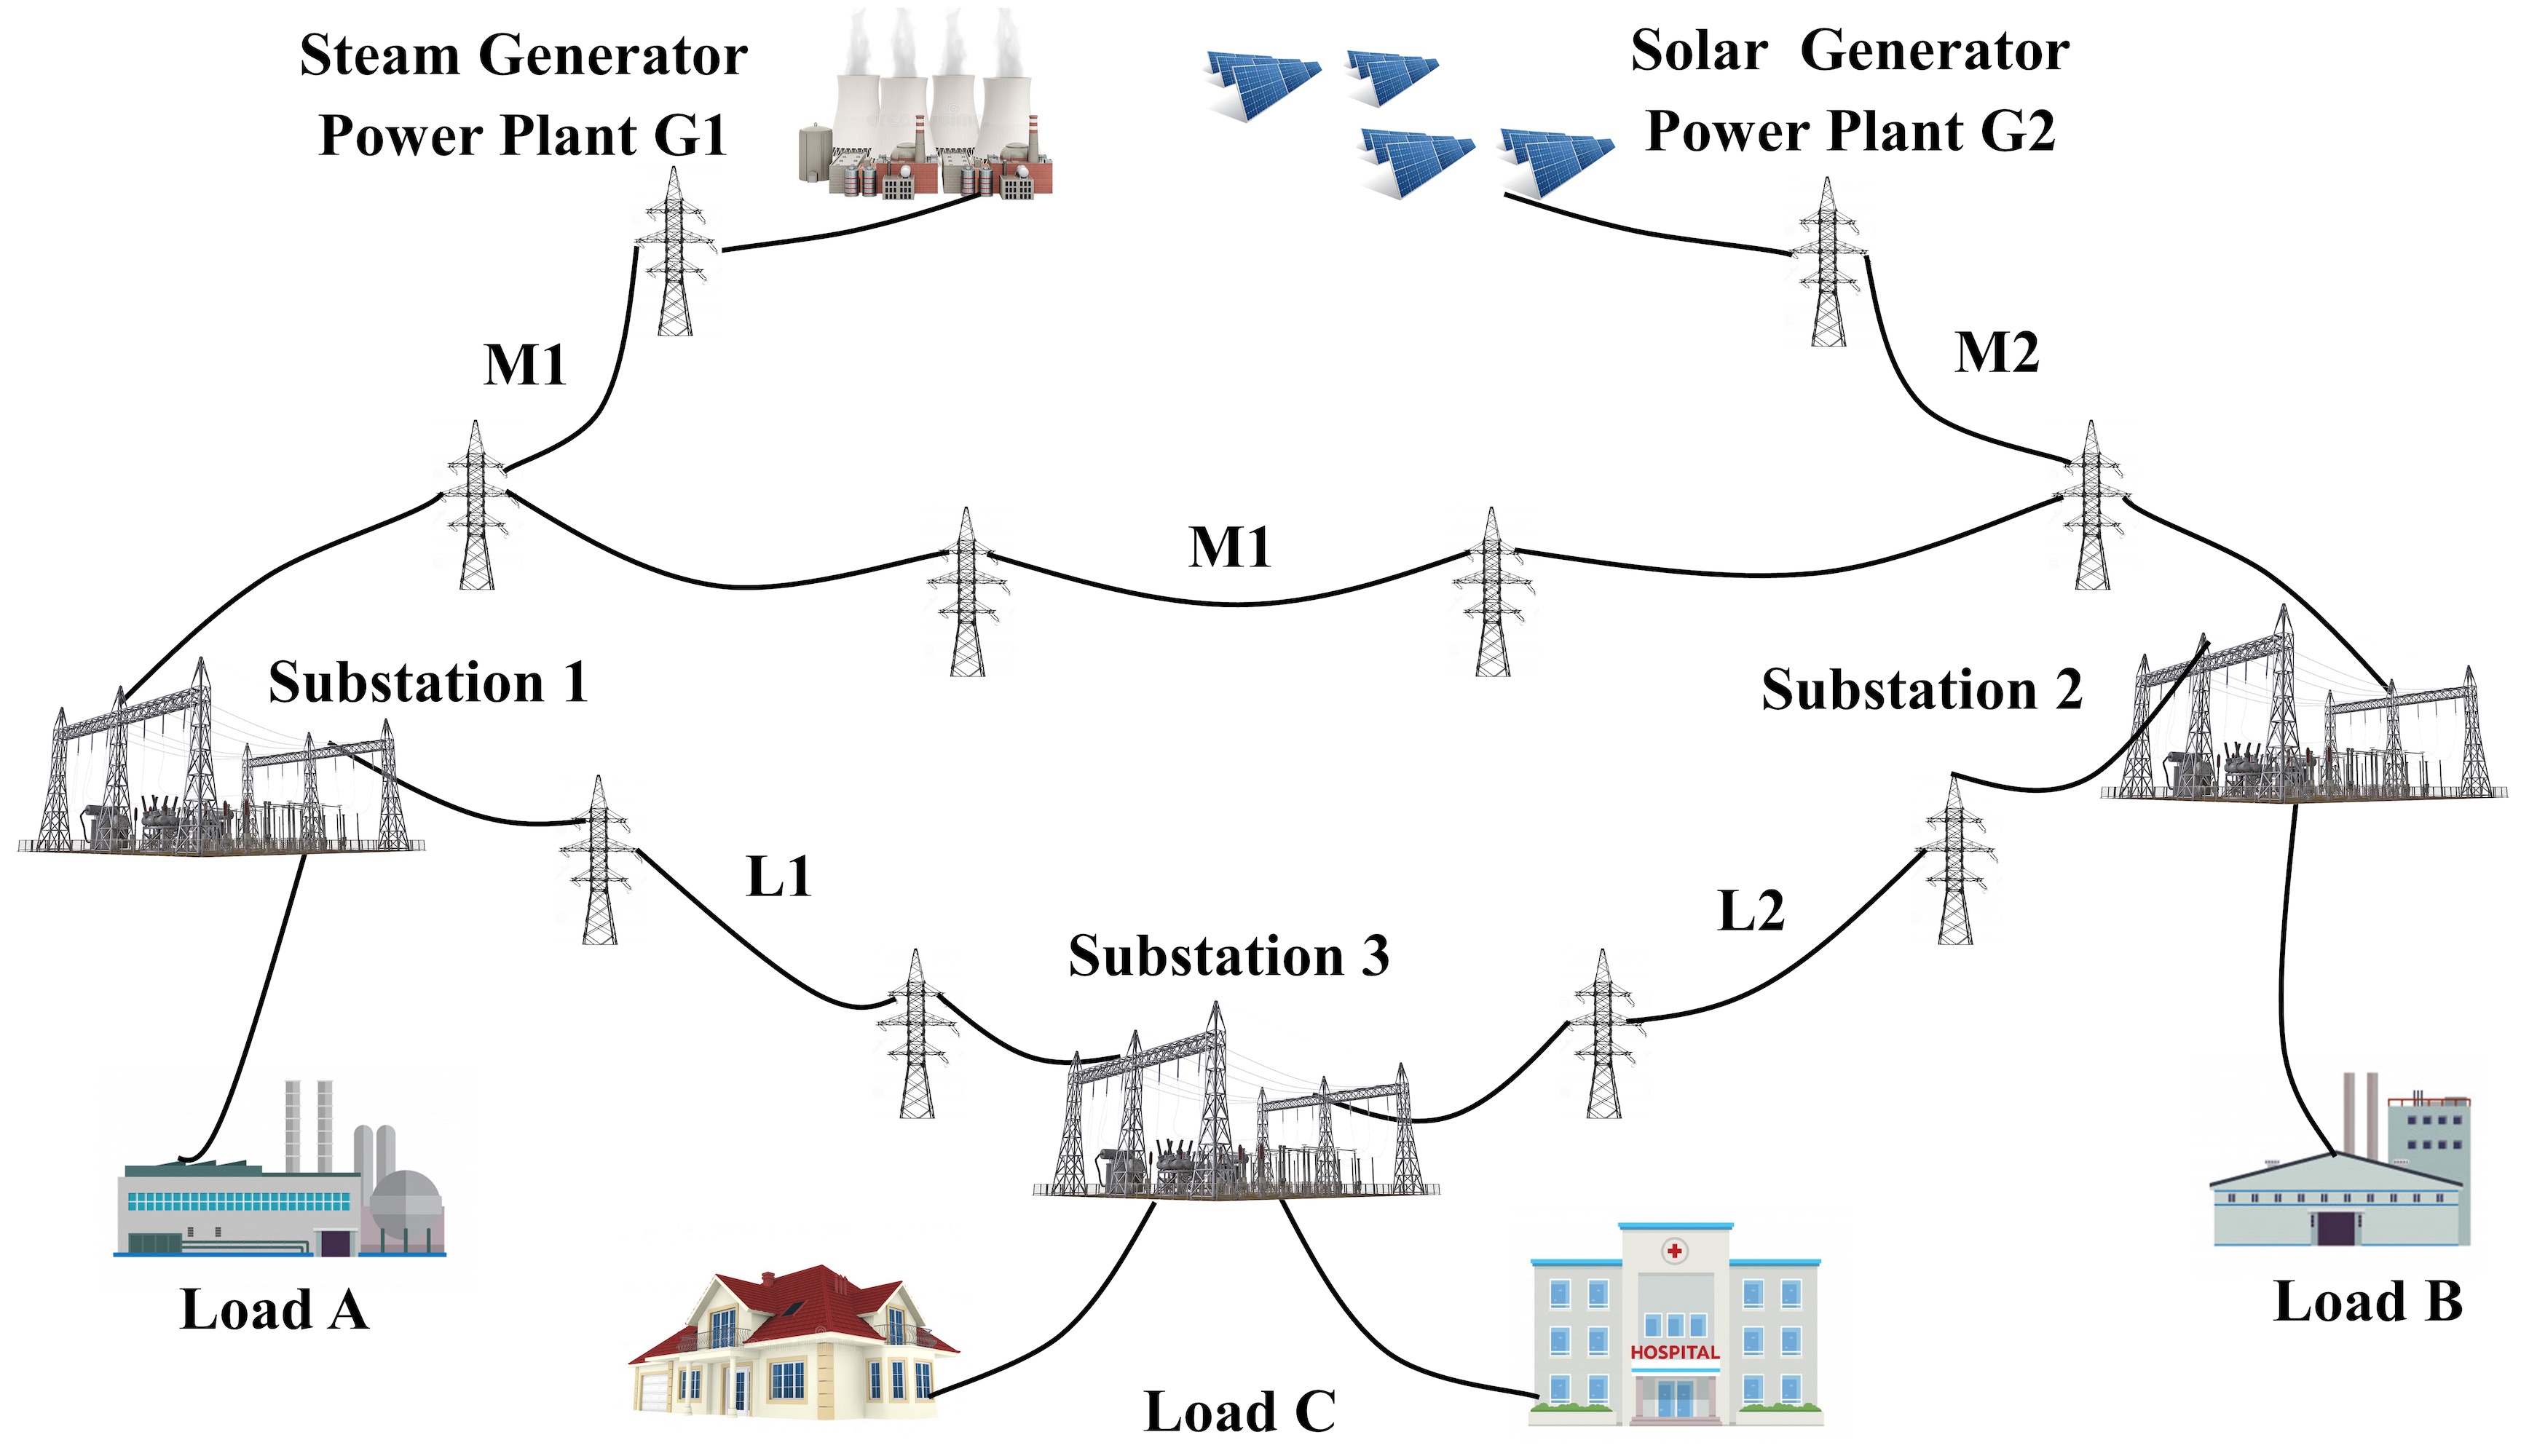
For smart power grid safety assessment, reliability engineers have been dividing the power network into three main hierarchical levels: (a) generation systems; (b) composite generation and transmission (or bulk power) systems; and (c) distribution systems. We can use our proposed ET library in HOL4 for the formal system-level reliability analysis of any hierarchical level in the power network and determine absolute accuracy of important smart grid reliability indices, such as System/Customer Average Interruption Frequency and Duration (SAIFI, SAIDI and CAIDI). In this application, we focus on the composite generation and transmission (or bulk power) systems, i.e., hierarchical level I. Consider the standard IEEE 3-bus of generation and transmission power network test case consisting of three main transmission lines (M), two lateral transmission lines (L), two generators (G), three (two step-up and one step-down) substations and three different industrial, commercial and residential loads A, B and C.
Technical Report:
M. Abdelghany, W. Ahmad, and S. Tahar: A Formally Verified HOL4 Algebra for Event Trees; Technical Report, Department of Electrical and Computer Engineering, Concordia University, April 2020 [17 Pages]. {Computing Research Repository (CoRR), Electrical Engineering and Systems Science, Systems and Control, arXiv.2004.14384}
Conference Paper:
M. Abdelghany, W. Ahmad, and S. Tahar, "Event Tree Reliability Analysis of Electrical Power Generation Network using Formal Techniques," in Electric Power and Energy Conference. IEEE, 2020, pp. 1-7.
2- IEEE 118-Bus Transmission Power Grid
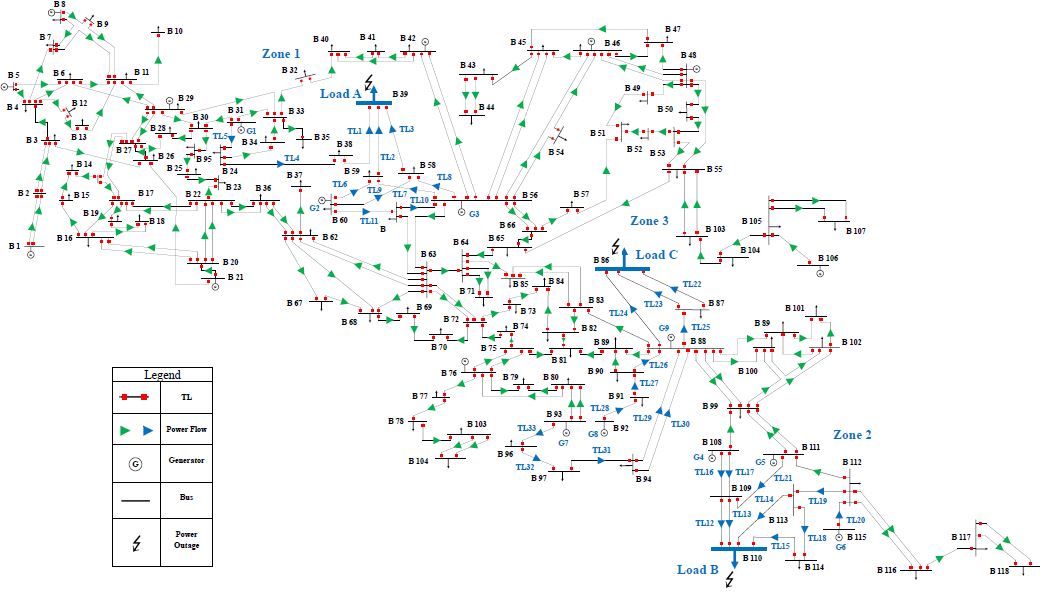
Despite the huge investment in upgrading the cyber-infrastructure of the power transmission system of smart grids, blackouts are still the common occurrence every year around the world. Therefore, there is a dire need to develop reliability analysis techniques for smart power grids making them more resilient to costly blackouts and enable back-up decisions. Using our proposed ET library in the HOL4 theorem prover, we can model the large-scale ET for any given smart power grid consisting of N transmission lines and M customers. Consider the standard IEEE 118-bus of a complex transmission power network test case representing a portion of the American electric power system (in the Midwestern US) consisting of 19 Generators (G), 186 Transmission Lines (TL), and 91 loads.
Journal Paper:
M. Abdelghany, W. Ahmad, and S. Tahar, "Event Tree Reliability Analysis of Safety Critical Systems using Theorem Proving," IEEE Systems Journal, April 2021 (accepted and under publishing)
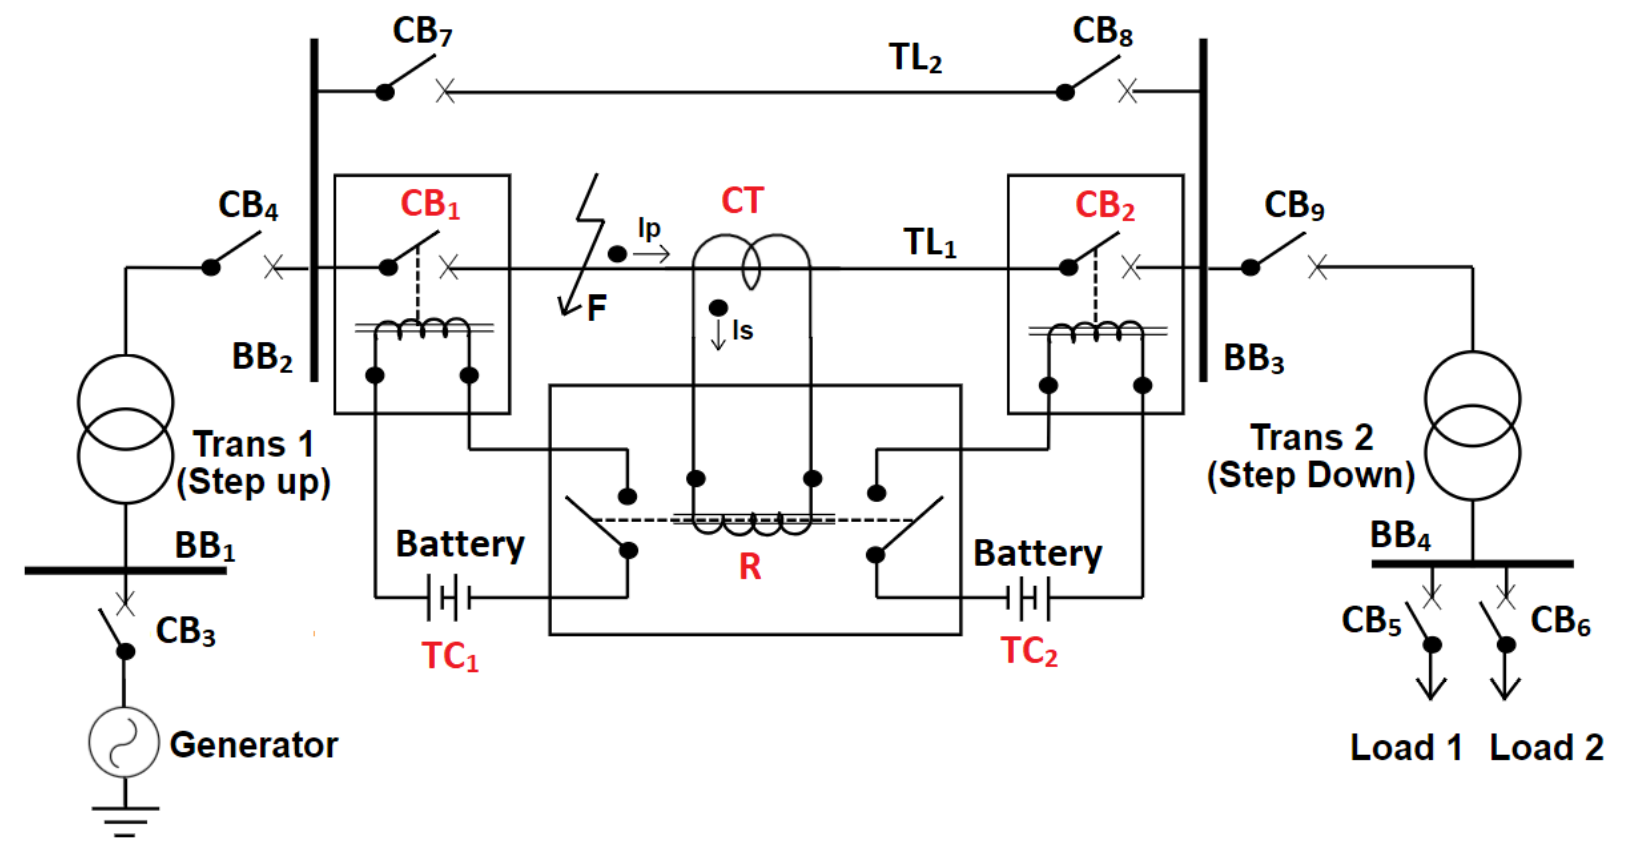
3- Transmission Line Protection Circuit
Trip circuit in a power grid system is used to isolate a specific transmission line from the rest of a smart grid in case a fault occurs. The cascaded failure for many transmission lines could lead to a blackout situation for the whole smart grid. Therefore, we used our proposed FETMA software, which is implemented in Python programming language, to perform system-level ET reliability analysis of the transmission line protection circuit. The power grid consists of one generator, 9 circuit breakers (CB), 4 bus bars (BB), 2 transmission lines (TL), 2 loads, 2 (on step up and one step down) transformers (Trans), 2 trip circuits (TC) with 1 protective relay (R) and 1 current transformer (CT).
Technical Report:
M. Abdelghany, W. Ahmad, and S. Tahar: ETMA: A New Software for Event Tree Analysis with Application to Power Protection; Technical Report, Department of Electrical and Computer Engineering, Concordia University, June 2020. [21 Pages]. {Computing Research Repository (CoRR), Electrical Engineering and Systems Science, Signal Processing, arXiv:2006.12383}
Conference Paper:
M. Abdelghany, W. Ahmed and S. Tahar: ETMA: An Efficient Tool for Event Trees Modeling and Analysis; Proc. IEEE International Systems Conference (SysCon'20), Montreal, Quebec, Canada, August 2020, pp. 1-8.
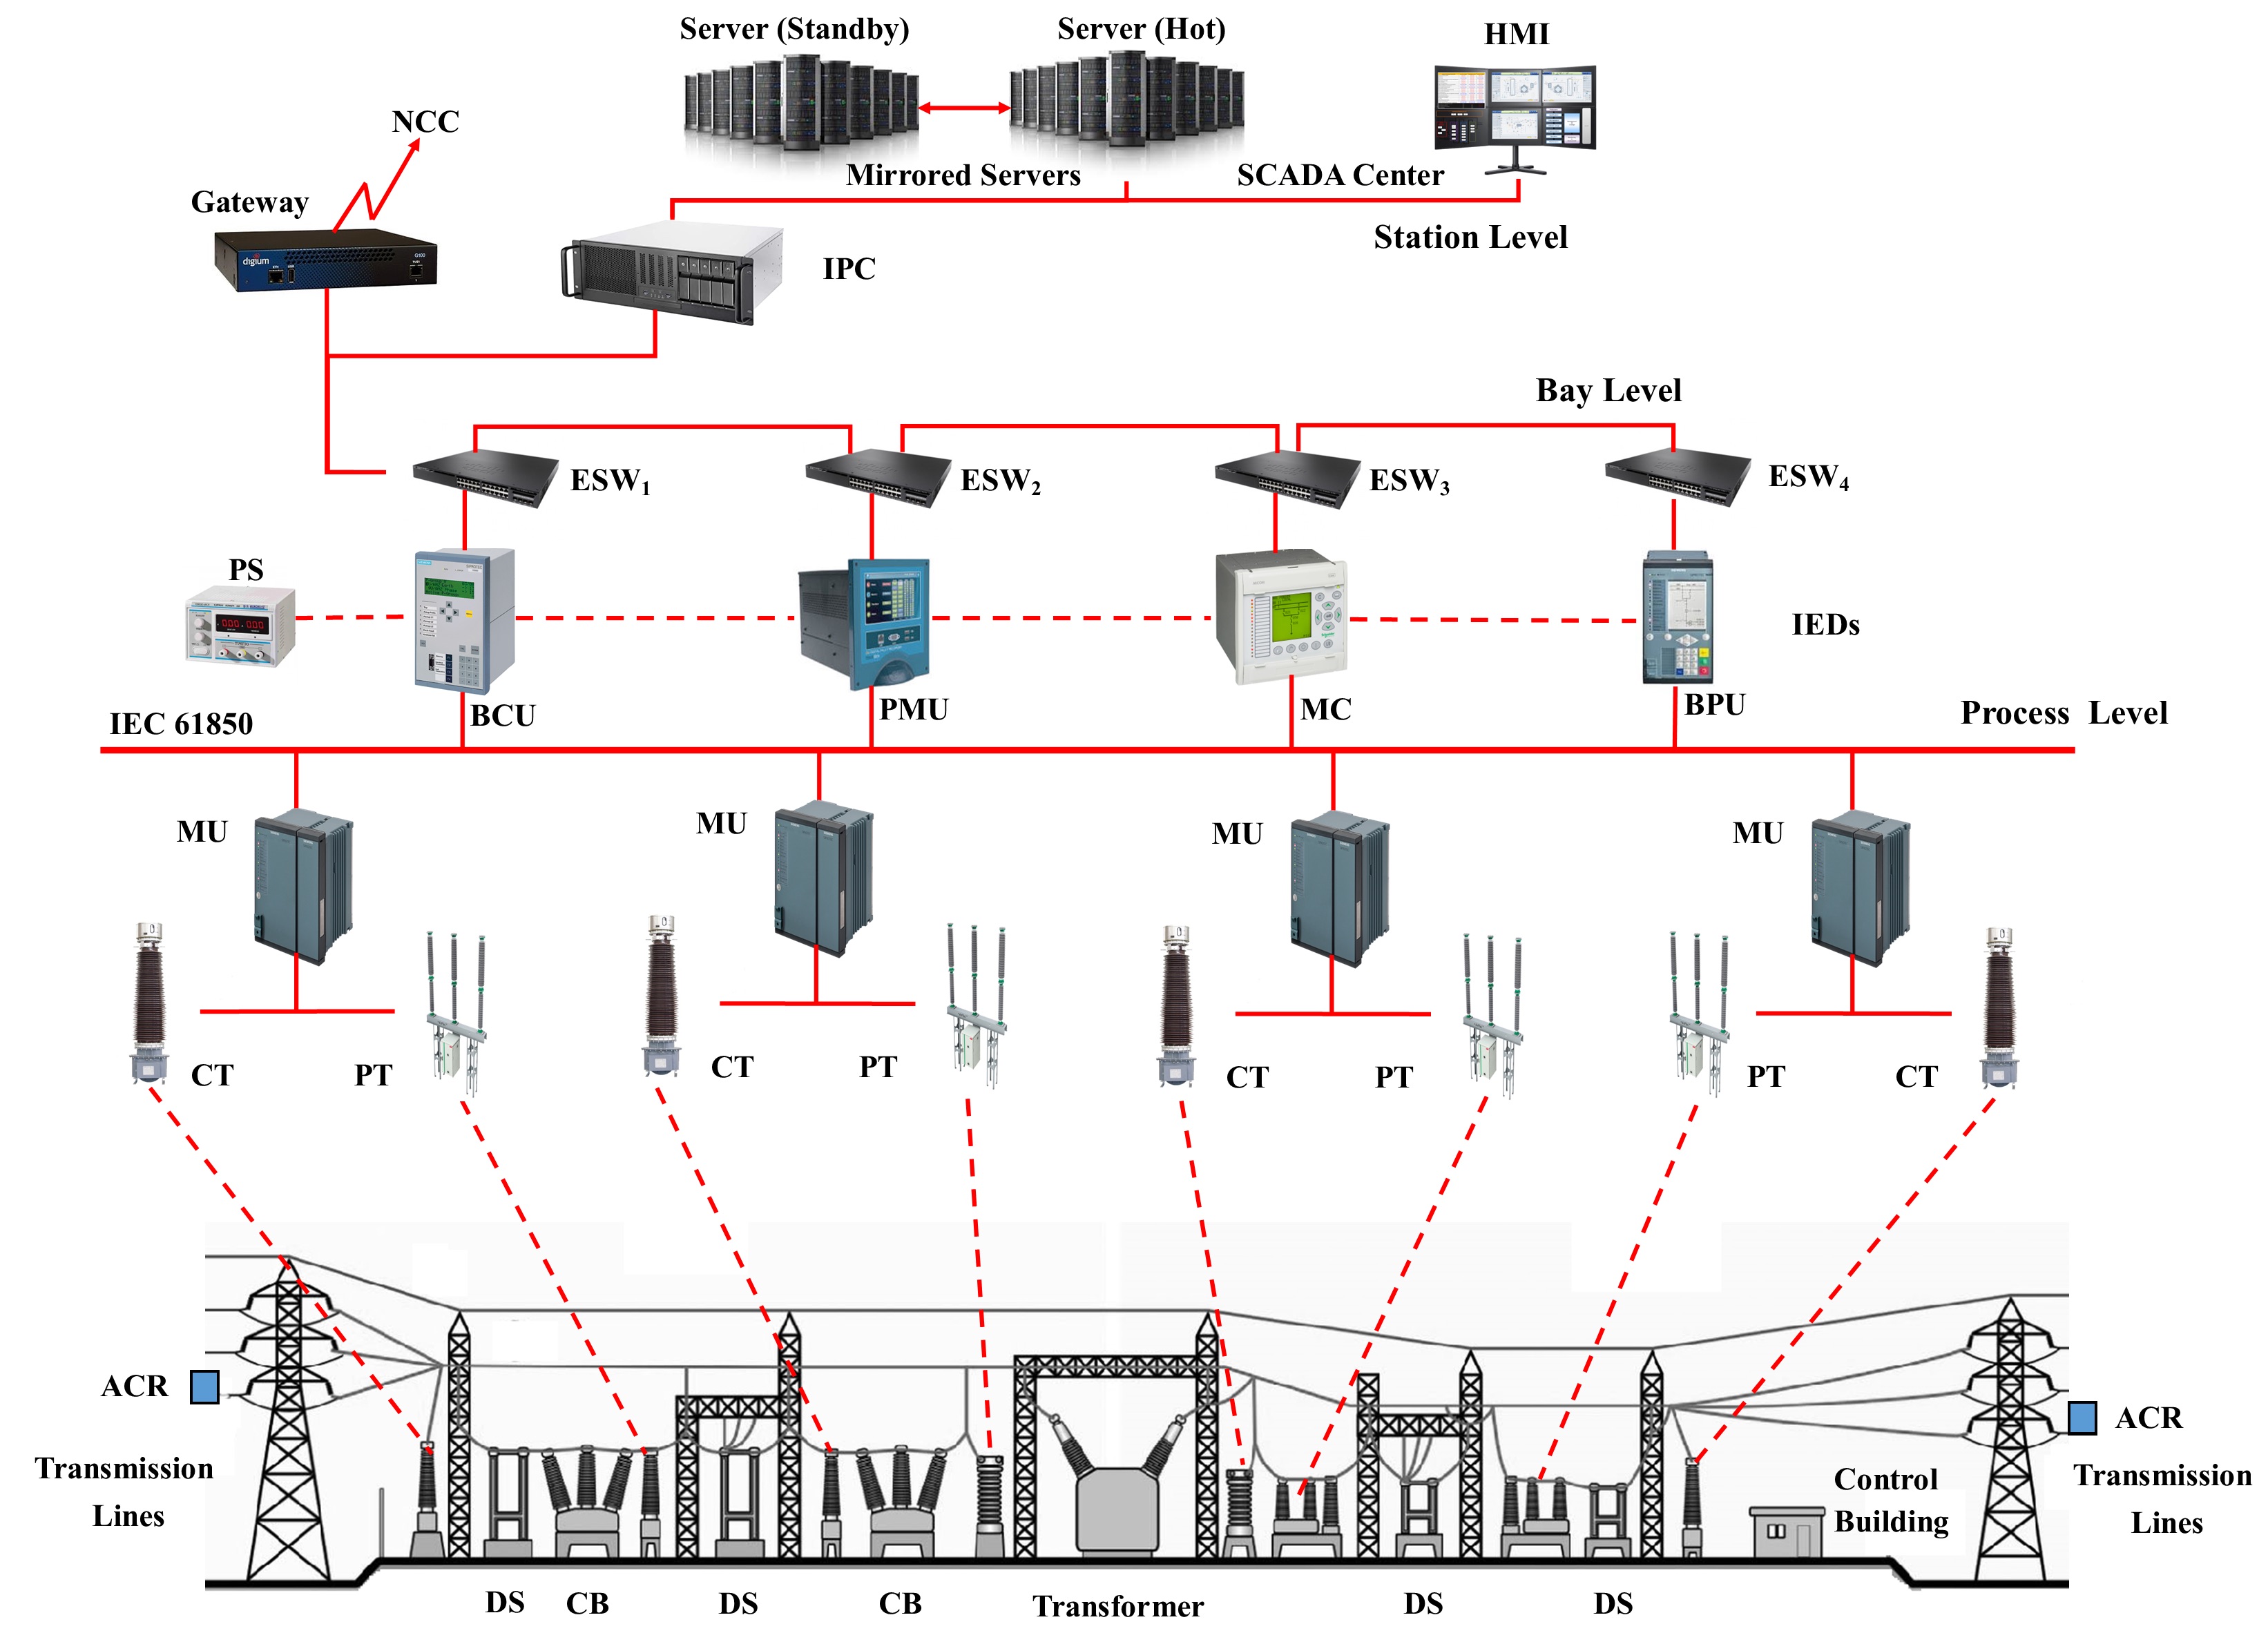
4- Smart Grid Automated Substation
Smart Automated Substations (SAS) of a smart power grid are constructed based on advanced monitoring infrastructure, control and protection devices, to operate as joint and multitask networks. For that reason, substation power equipment, such as Automatic Circuit Reclosers (ACR), Circuit Breakers (CB), Disconnecting Switches (DS), Current Transformers (CT), and Potential Transformers (PT), have been equipped with digital transceivers, making the control and automation through the SAS more achievable. The IEC 61850 standard is utilized specifically for the communication sector in substation automation, which provides interoperability, reliability, and safety. An automated substation of a smart power grid consists of three main hierarchical levels, Process, Bay and Station. Process Level includes Merging Units (MU) to collect periodically the analog data from sensors and indicators of switchgear equipment, such as CTs, PTs and CBs, through copper wiring. Then MUs transit all equipment data to the upper process bus through a digital network. Bay Level consists of Intelligent Electronic Devices (IED), such as Bay Control Units (BCU), Bay Protection Units (BPU), Phasor Measurement Units (PMU), and Measuring Centers (MC), which are energized by a DC Power Supply (PS) and they are responsible for gathering all real-time data in each bay and send them to the higher level via communication Ethernet (EI) devices, such as Ethernet Switches (ESW). Station Level integrates the Supervisory Control and Data Acquisition (SCADA) center to perform remote monitoring and controlling of the SAS system. The SCADA system uses Industrial Personal Computer (IPC) and Human Machine Interface (HMI) to display the real-time process data. SCADA also restores all collected data from the Bay Level in a main Server (Hot) as well as a backup mirrored Server (Standby) to prevent the cause of permanent data loss of the SAS. Moreover, the SCADA system utilizes a Gateway (GW) to provide a connection to upper-level Network Control Center (NCC) in the SG power system. We used our proposed FETMA software to analyze the probabilities of all possible classes of accident events that can occur in the SAS at the subsystem level.
Journal Paper:
M. Abdelghany and S. Tahar, "A Software for Functional Block Diagram and Event Tree based Safety Analysis," Elsevier Journal of Systems and Software (under revision)
5- Nuclear Power Plant
Inside the nuclear power station, the conversion to electrical energy takes place similar to other thermal power stations. First, the nuclear reactor heats the reactor coolant, which could be water or gas, based on the reactor's type. Then, the reactor coolant passes to a steam generator, which heats water and produces a steam flow. The pressurized steam flow then goes to a steam turbine, which starts to produce power and the remaining vapor is condensed through a condenser. The condenser is used to exchange heat through a secondary side, for instance, a river or a cooling tower. The condensed water is again pumped back to the steam generator and the cycle repeats. We used our FBD library in the HOL4 to analyze the probabilities of all possible safety classes of accident events that can occur in the nuclear reactor at the subsystem level.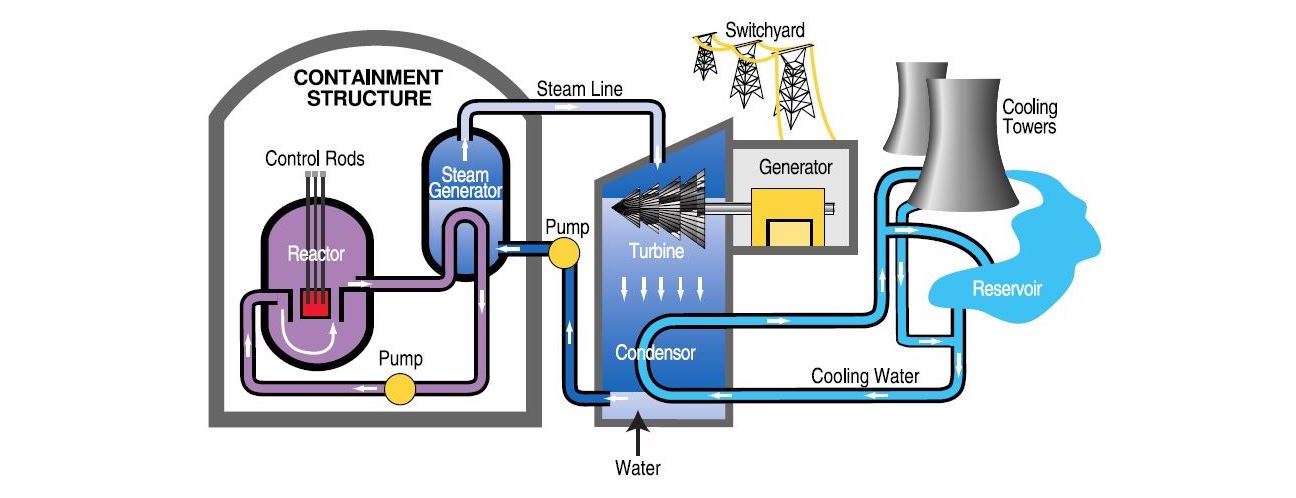
Conference Paper:
M. Abdelghany and S. Tahar, "Functional Block Diagram based Safety Analysis of Complex Systems using Theorem Proving," in 26th International Conference on Formal Methods for Industrial Critical Systems (FMICS'21), Paris, France, May 2021. (under submission)
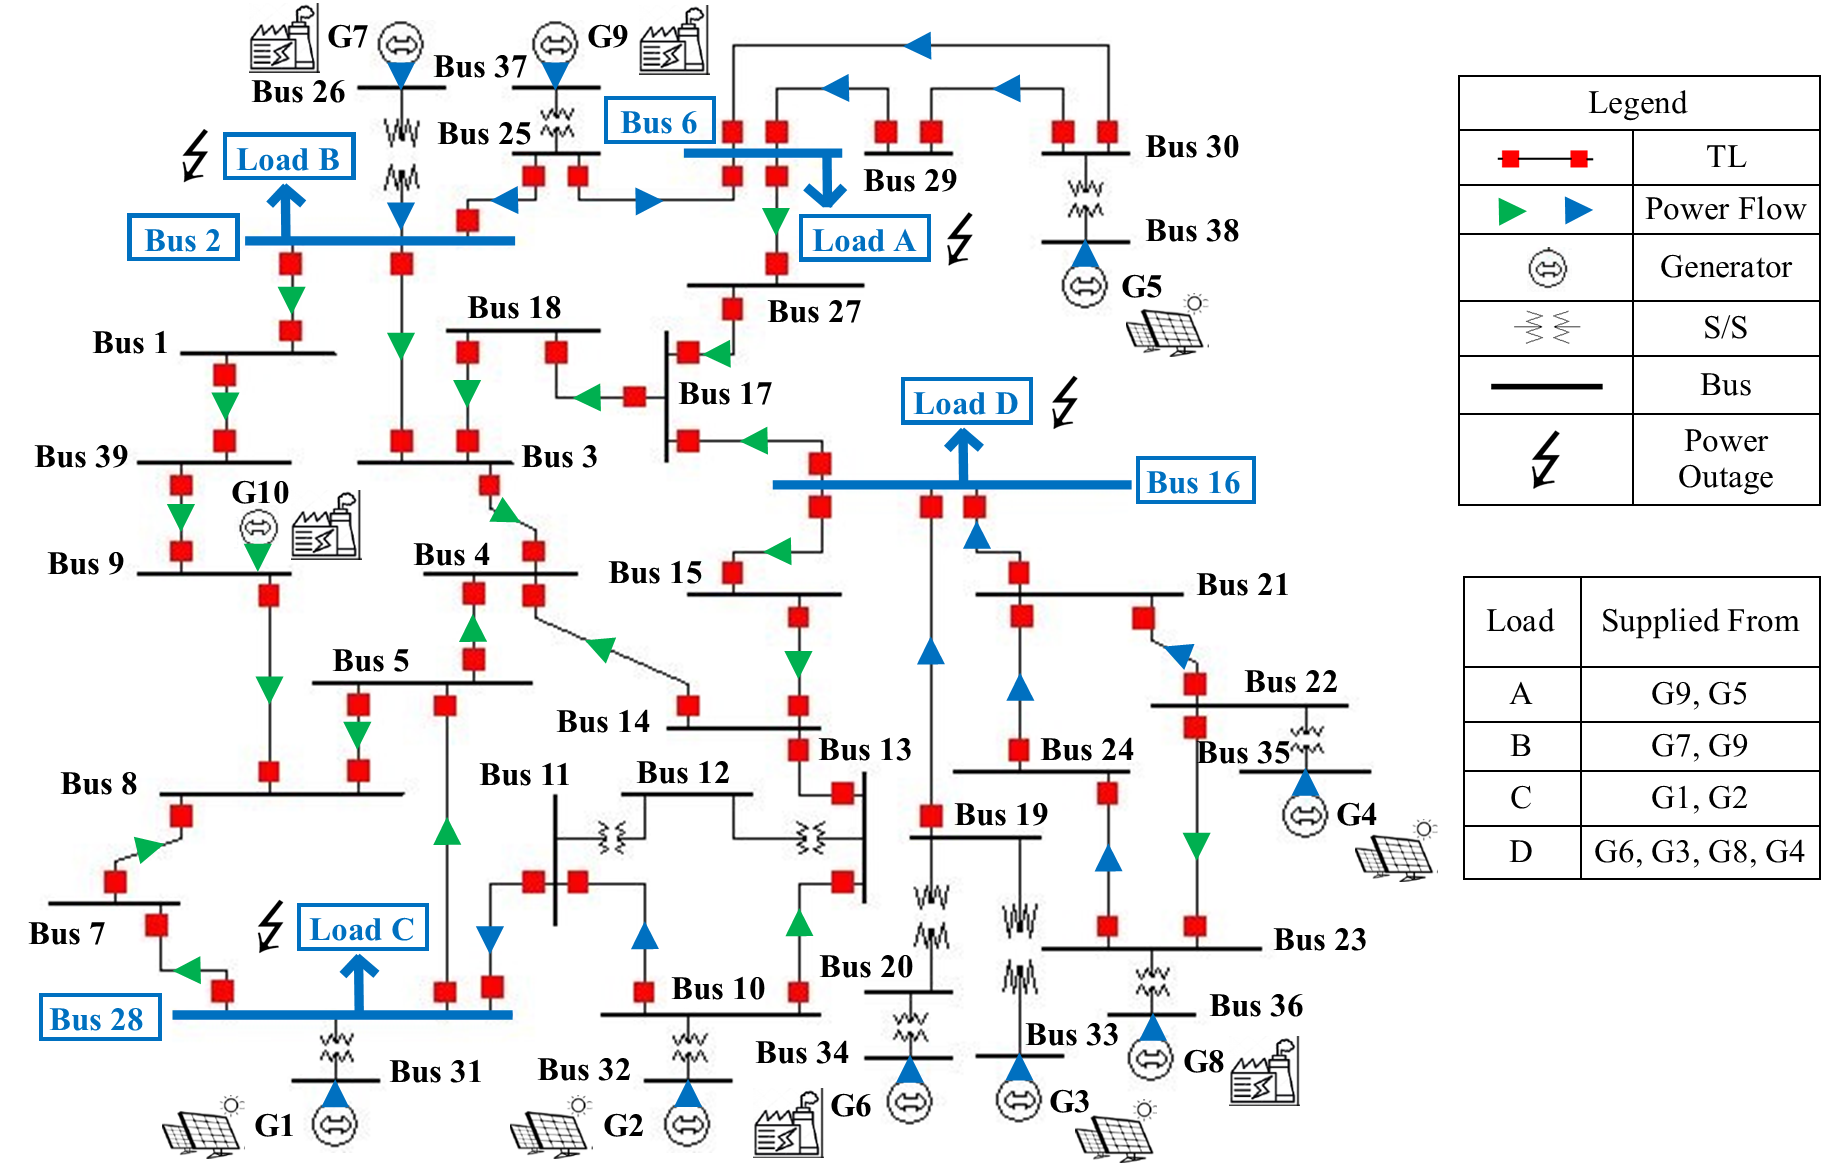
6- IEEE 39-Bus Distributed Generation Network
The standard IEEE 39-bus electrical power network test system is consisting of 10 generators (G), 12 substations (S/S), 39 Buses (Bus), and 34 transmission lines (TL). Assuming the generators G1-G10 are of two types: (i) solar photo-voltaic (PV) power plants G1-G5; and (ii) steam power plants G6-G10. Using the Optimal Power Flow (OPF) optimization, we can determine the flow of electricity from generators to consumers in the power network. We used our FT/ET-based CCD library in HOL4 to analyze all possible safety classes of reliability and failure consequence events that can occur in the electrical power network at the distributed generation subsystem level and determine absolute accuracy of power system reliability indices, such as Forced Outage Rate (FOR) and System Average Interruption Duration Index (SAIDI).
Journal Paper:
M. Abdelghany and S. Tahar, "Cause-Consequence Diagram Reliability Analysis using Formal Techniques with Application to Electrical Power Networks," IEEE Access, Vol. 9, January 2021, pp. 23929-23943.
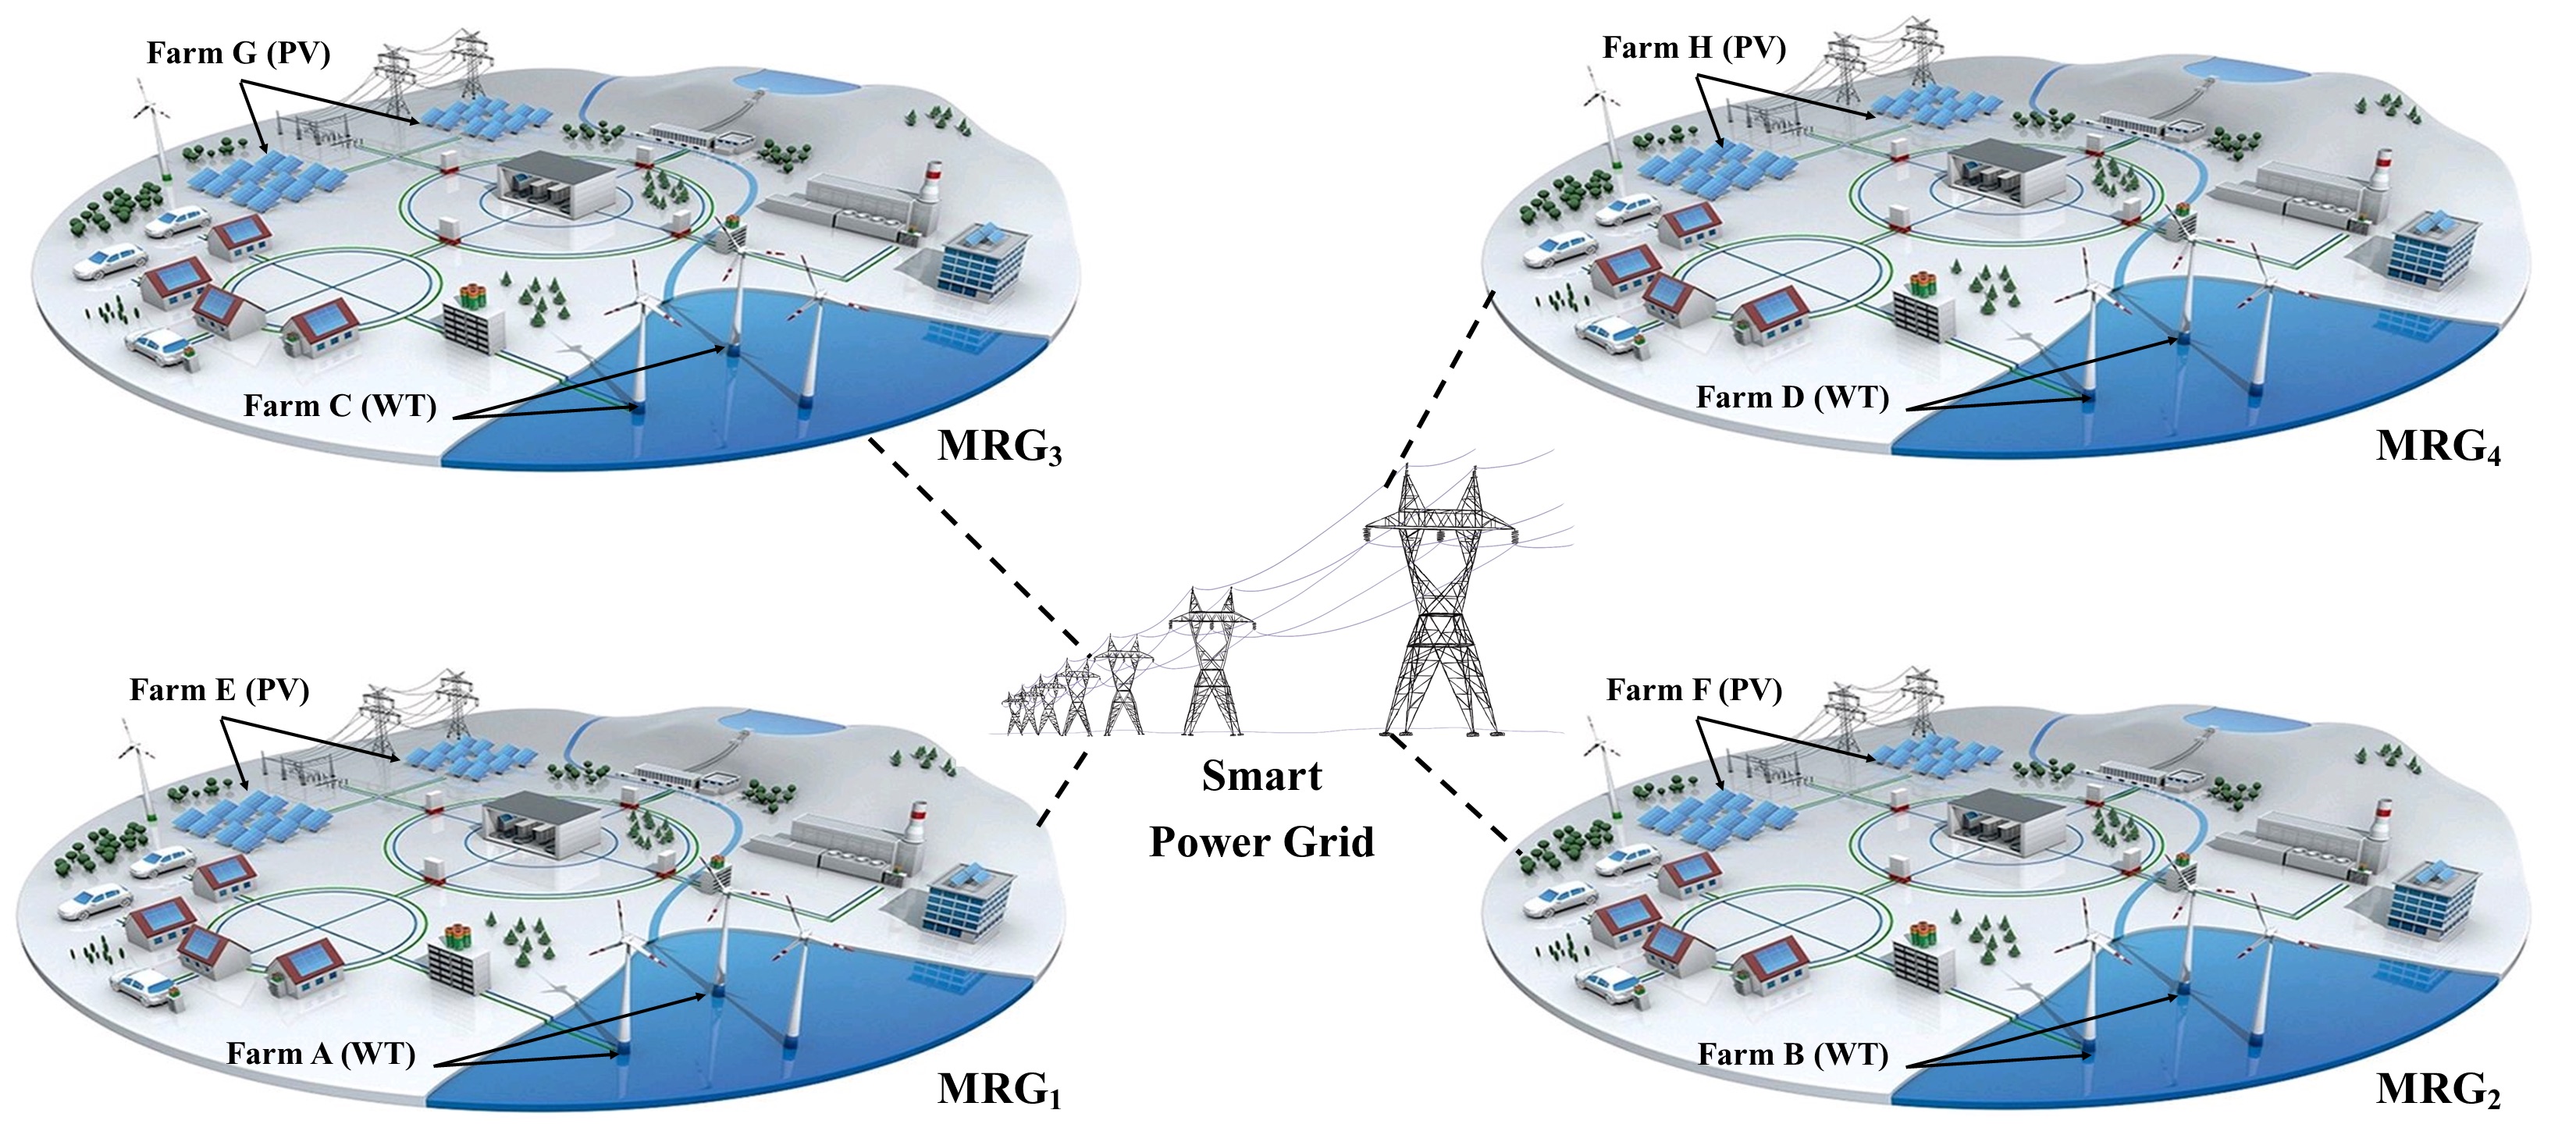
7- Interconnected Microgrid Renewable and Clean Power Grids
A smart power grid consists of Interconnected Microgrid Renewable and Green (MRG) power grids incorporating 100 % Renewable Energy Resources power plants, such as Wind Turbine (WT) and solar photo-voltaic (PV). Assuming that each WT/PV farm in all MRGs is consisting of five generating units. We used our proposed novel n-level RBD/ET-based CCD library in HOL4 to analyze all possible safety classes of reliability and failure consequence events that can occur in the whole smart grid at each MRG subsystem level. Subsequently, we verified in HOL4 the probabilistic expressions of different smart grid system reliability and energy indices, such as the Loss of Load Expectation (LOLE), Loss of Energy Expectation (LOEE), Equivalent Forced Outage Rate (EFOR), and Energy Index of Reliability (EIR).
Conference Paper:
M. Abdelghany and S. Tahar, "Formalization of RBD-based Cause Consequence Analysis in HOL," in 14th Conference on Intelligent Computer Mathematics (CICM'21), Timisoara, Romania, April 2021. (under revision)
Journal Paper:
M. Abdelghany and S. Tahar, "Formal Reliability Analysis of Interconnected Microgrid Renewable and Green Power Grids," IEEE Transactions on Power Systems, May 2021 (under submission)
Applications
For smart power grid safety assessment, reliability engineers have been dividing the power network into three main hierarchical levels: (a) generation systems; (b) composite generation and transmission (or bulk power) systems; and (c) distribution systems. We can use our proposed ET library in HOL4 for the formal system-level reliability analysis of any hierarchical level in the power network and determine absolute accuracy of important smart grid reliability indices, such as System/Customer Average Interruption Frequency and Duration (SAIFI, SAIDI and CAIDI). In this application, we focus on the composite generation and transmission (or bulk power) systems, i.e., hierarchical level I. Consider the standard IEEE 3-bus of generation and transmission power network test case consisting of three main transmission lines (M), two lateral transmission lines (L), two generators (G), three (two step-up and one step-down) substations and three different industrial, commercial and residential loads A, B and C.
Technical Report:
M. Abdelghany, W. Ahmad, and S. Tahar: A Formally Verified HOL4 Algebra for Event Trees; Technical Report, Department of Electrical and Computer Engineering, Concordia University, April 2020 [17 Pages]. {Computing Research Repository (CoRR), Electrical Engineering and Systems Science, Systems and Control, arXiv.2004.14384}
Conference Paper:
M. Abdelghany, W. Ahmad, and S. Tahar, "Event Tree Reliability Analysis of Electrical Power Generation Network using Formal Techniques," in Electric Power and Energy Conference. IEEE, 2020, pp. 1-7.
2- IEEE 118-Bus Transmission Power Grid
Despite the huge investment in upgrading the cyber-infrastructure of the power transmission system of smart grids, blackouts are still the common occurrence every year around the world. Therefore, there is a dire need to develop reliability analysis techniques for smart power grids making them more resilient to costly blackouts and enable back-up decisions. Using our proposed ET library in the HOL4 theorem prover, we can model the large-scale ET for any given smart power grid consisting of N transmission lines and M customers. Consider the standard IEEE 118-bus of a complex transmission power network test case representing a portion of the American electric power system (in the Midwestern US) consisting of 19 Generators (G), 186 Transmission Lines (TL), and 91 loads.
Journal Paper:
M. Abdelghany, W. Ahmad, and S. Tahar, "Event Tree Reliability Analysis of Safety Critical Systems using Theorem Proving," IEEE Systems Journal, April 2021 (accepted and under publishing)
3- Transmission Line Protection Circuit
Trip circuit in a power grid system is used to isolate a specific transmission line from the rest of a smart grid in case a fault occurs. The cascaded failure for many transmission lines could lead to a blackout situation for the whole smart grid. Therefore, we used our proposed FETMA software, which is implemented in Python programming language, to perform system-level ET reliability analysis of the transmission line protection circuit. The power grid consists of one generator, 9 circuit breakers (CB), 4 bus bars (BB), 2 transmission lines (TL), 2 loads, 2 (on step up and one step down) transformers (Trans), 2 trip circuits (TC) with 1 protective relay (R) and 1 current transformer (CT).
Technical Report:
M. Abdelghany, W. Ahmad, and S. Tahar: ETMA: A New Software for Event Tree Analysis with Application to Power Protection; Technical Report, Department of Electrical and Computer Engineering, Concordia University, June 2020. [21 Pages]. {Computing Research Repository (CoRR), Electrical Engineering and Systems Science, Signal Processing, arXiv:2006.12383}
Conference Paper:
M. Abdelghany, W. Ahmed and S. Tahar: ETMA: An Efficient Tool for Event Trees Modeling and Analysis; Proc. IEEE International Systems Conference (SysCon'20), Montreal, Quebec, Canada, August 2020, pp. 1-8.
4- Smart Grid Automated Substation
Smart Automated Substations (SAS) of a smart power grid are constructed based on advanced monitoring infrastructure, control and protection devices, to operate as joint and multitask networks. For that reason, substation power equipment, such as Automatic Circuit Reclosers (ACR), Circuit Breakers (CB), Disconnecting Switches (DS), Current Transformers (CT), and Potential Transformers (PT), have been equipped with digital transceivers, making the control and automation through the SAS more achievable. The IEC 61850 standard is utilized specifically for the communication sector in substation automation, which provides interoperability, reliability, and safety. An automated substation of a smart power grid consists of three main hierarchical levels, Process, Bay and Station. Process Level includes Merging Units (MU) to collect periodically the analog data from sensors and indicators of switchgear equipment, such as CTs, PTs and CBs, through copper wiring. Then MUs transit all equipment data to the upper process bus through a digital network. Bay Level consists of Intelligent Electronic Devices (IED), such as Bay Control Units (BCU), Bay Protection Units (BPU), Phasor Measurement Units (PMU), and Measuring Centers (MC), which are energized by a DC Power Supply (PS) and they are responsible for gathering all real-time data in each bay and send them to the higher level via communication Ethernet (EI) devices, such as Ethernet Switches (ESW). Station Level integrates the Supervisory Control and Data Acquisition (SCADA) center to perform remote monitoring and controlling of the SAS system. The SCADA system uses Industrial Personal Computer (IPC) and Human Machine Interface (HMI) to display the real-time process data. SCADA also restores all collected data from the Bay Level in a main Server (Hot) as well as a backup mirrored Server (Standby) to prevent the cause of permanent data loss of the SAS. Moreover, the SCADA system utilizes a Gateway (GW) to provide a connection to upper-level Network Control Center (NCC) in the SG power system. We used our proposed FETMA software to analyze the probabilities of all possible classes of accident events that can occur in the SAS at the subsystem level.
Journal Paper:
M. Abdelghany and S. Tahar, "A Software for Functional Block Diagram and Event Tree based Safety Analysis," Elsevier Journal of Systems and Software (under revision)
5- Nuclear Power Plant
Inside the nuclear power station, the conversion to electrical energy takes place similar to other thermal power stations. First, the nuclear reactor heats the reactor coolant, which could be water or gas, based on the reactor's type. Then, the reactor coolant passes to a steam generator, which heats water and produces a steam flow. The pressurized steam flow then goes to a steam turbine, which starts to produce power and the remaining vapor is condensed through a condenser. The condenser is used to exchange heat through a secondary side, for instance, a river or a cooling tower. The condensed water is again pumped back to the steam generator and the cycle repeats. We used our FBD library in the HOL4 to analyze the probabilities of all possible safety classes of accident events that can occur in the nuclear reactor at the subsystem level.
Conference Paper:
M. Abdelghany and S. Tahar, "Functional Block Diagram based Safety Analysis of Complex Systems using Theorem Proving," in 26th International Conference on Formal Methods for Industrial Critical Systems (FMICS'21), Paris, France, May 2021. (under submission)
6- IEEE 39-Bus Distributed Generation Network
The standard IEEE 39-bus electrical power network test system is consisting of 10 generators (G), 12 substations (S/S), 39 Buses (Bus), and 34 transmission lines (TL). Assuming the generators G1-G10 are of two types: (i) solar photo-voltaic (PV) power plants G1-G5; and (ii) steam power plants G6-G10. Using the Optimal Power Flow (OPF) optimization, we can determine the flow of electricity from generators to consumers in the power network. We used our FT/ET-based CCD library in HOL4 to analyze all possible safety classes of reliability and failure consequence events that can occur in the electrical power network at the distributed generation subsystem level and determine absolute accuracy of power system reliability indices, such as Forced Outage Rate (FOR) and System Average Interruption Duration Index (SAIDI).
Journal Paper:
M. Abdelghany and S. Tahar, "Cause-Consequence Diagram Reliability Analysis using Formal Techniques with Application to Electrical Power Networks," IEEE Access, Vol. 9, January 2021, pp. 23929-23943.
7- Interconnected Microgrid Renewable and Clean Power Grids
A smart power grid consists of Interconnected Microgrid Renewable and Green (MRG) power grids incorporating 100 % Renewable Energy Resources power plants, such as Wind Turbine (WT) and solar photo-voltaic (PV). Assuming that each WT/PV farm in all MRGs is consisting of five generating units. We used our proposed novel n-level RBD/ET-based CCD library in HOL4 to analyze all possible safety classes of reliability and failure consequence events that can occur in the whole smart grid at each MRG subsystem level. Subsequently, we verified in HOL4 the probabilistic expressions of different smart grid system reliability and energy indices, such as the Loss of Load Expectation (LOLE), Loss of Energy Expectation (LOEE), Equivalent Forced Outage Rate (EFOR), and Energy Index of Reliability (EIR).
Conference Paper:
M. Abdelghany and S. Tahar, "Formalization of RBD-based Cause Consequence Analysis in HOL," in 14th Conference on Intelligent Computer Mathematics (CICM'21), Timisoara, Romania, April 2021. (under revision)
Journal Paper:
M. Abdelghany and S. Tahar, "Formal Reliability Analysis of Interconnected Microgrid Renewable and Green Power Grids," IEEE Transactions on Power Systems, May 2021 (under submission)